
Email open rates are still treated as the answer to internal communications performance, but they only show that a message was delivered and opened. Internal communications KPIs should trace the full path from reach to comprehension, action, and business impact. For frontline and deskless teams, that means pairing channel data with operational signals such as safety reporting, task completion, mobile adoption, feedback, and manager cascade effectiveness.
Key Takeaways
- Open rates are baseline signals, not proof of effectiveness. Pair them with read time, comprehension, response, and downstream action.
- The strongest internal communications metrics connect to a defined workforce outcome, such as policy adoption, safety compliance, tool migration, or retention.
- Frontline communication metrics need segmentation by location, shift, role, worker type, device, and tenure.
- Leadership dashboards should show one KPI per measurement family, not a long list of disconnected channel statistics.
- Internal communications reporting should be honest about contribution, especially when HR, managers, technology, and operations also influence the result.
Moving Beyond Vanity Metrics in Internal Communications
A high email open rate can make a campaign look successful while employees remain unclear about what to do next. Open rates and click-through rates still have a place in internal communications measurement, but they’re evidence of exposure and interaction, not evidence that employees understood a policy, adopted a tool, followed a safety procedure, or changed a decision.
That distinction matters most in frontline-heavy organizations. Employees working in stores, plants, hospitals, vehicles, warehouses, construction sites, and field locations may have limited desktop access or no work email at all. A company-wide average can therefore reward the channel that reaches corporate employees while hiding the people who carry out the operational work.
The better model is a hierarchy of evidence:
- Delivery and reach, did the intended audience receive the message?
- Consumption, did employees open, view, watch, or spend time with it?
- Comprehension, can they explain the important point?
- Behavior, did they complete the intended action?
- Business impact, did the communication contribute to a meaningful operational or workforce result?
Industry benchmarks for 2026 show that communicators are most often accountable for strategy awareness at 70%, behavior change at 49%, and digital reach at 46%, followed by policy compliance, learning and development participation, employee retention, employee advocacy, internal mobility, and candidate attraction. Those figures show why the discipline is moving from broadcast efficiency toward what employees know, do, and support, as outlined in Claromentis’ employee engagement metrics benchmark.
Practical rule: Define the action or outcome before selecting the channel metric. Otherwise, the easiest number to collect becomes the KPI by default.
A communication campaign about a new scheduling process might use delivery and app views to identify reach, a short comprehension check to identify clarity, and completed schedule changes to identify action. A safety update might use mobile delivery, acknowledgment, near-miss reporting, and manager feedback. The same open rate can’t answer both questions.
Teams also need an employee listening layer. Feedback, comments, pulse responses, and manager observations explain why a metric moved, while operational data shows whether the communication affected work. A practical employee listening strategy connects those signals instead of treating communication as a one-way publishing function.
Core Internal Communications KPIs and Benchmarks
The most useful internal communication KPIs combine operational baseline metrics with deeper indicators of attention, understanding, and action. Start with delivery, open rate, click-through rate, read time, reach rate, video completion, intranet or app logins, channel engagement, and push notification open rate. Then connect those signals to comprehension, feedback, completion, adoption, sentiment, or another outcome that matches the campaign.
A practical internal email benchmark sits around 66% to 76% average open rate across large datasets. One benchmark analyzed more than 2 billion internal emails sent to nearly 11 million employees and reported a 66% average open rate, while another large enterprise sample reported 76%, as documented in the 2026 internal email benchmark report. These figures are useful for context, but they don’t establish whether employees understood or acted.
The measurement funnel
| Funnel stage | Core metrics | What it proves |
|---|---|---|
| Reach | Delivery rate, audience reach, SMS delivery, push delivery, unique views | The message was available to the intended audience |
| Consumption | Open rate, click-through rate, read time, video completion, app login | Employees interacted with the channel or content |
| Comprehension | Pulse responses, knowledge checks, manager readiness, question themes | Employees understood the important information |
| Behavior | Policy acknowledgment, task completion, training completion, tool adoption | Employees took the intended action |
| Business impact | eNPS, onboarding completion, safety reporting, issue resolution, retention indicators | Communication contributed to a workforce or operational result |
The distinction between a metric and a KPI matters. A metric is a data point. A KPI is a selected measure tied to a priority. For example, pageviews can indicate interest in an intranet article, while completed policy acknowledgment can serve as the KPI for a compliance campaign.
A 2023 global benchmark found that 93% of internal communicators were jointly or solely responsible for employee engagement. It also reported that 70% of people intending to stay with their employer long term rated communication as excellent, compared with 24% among people rating communication as good. Only 13% of employees gave their organization top marks for internal communication. These findings, summarized in Blink’s employee engagement statistics, help explain why sentiment, eNPS, feedback-loop participation, and retention indicators increasingly sit alongside channel metrics.
For a leadership audience, the point isn’t to report every available measure. It’s to select a small group that answers whether the communication reached the right people, made sense, drove action, and supported the business. That’s the foundation of credible internal communications ROI reporting.
Measuring Frontline and Deskless Employee Communication
Frontline communication metrics should measure access and action in the environment where work happens. Email may remain useful for managers or corporate teams, but it can be a weak proxy for employees who work shifts, share devices, move between locations, or rarely log in during a shift.
The first step is to build an audience map. Record each group’s location, role, shift pattern, worker type, primary device, available channels, and operational constraints. Then report performance by those segments instead of relying on a blended company average.
A practical frontline measurement process
- Identify the required audience. Separate locations, shifts, roles, employment types, and deskless or desk-based access. Include language or accessibility needs where they affect comprehension.
- Match the channel to the work setting. Track SMS delivery and response, app adoption, push notification open rate, kiosk or intranet access, manager cascade completion, and attendance where relevant.
- Measure the intended action. A safety message may require a report, inspection, acknowledgment, or completed training. A scheduling update may require a shift confirmation or swap. Don’t substitute a notification open for the action itself.
- Compare cohorts. Review results by location, shift, role, tenure, and device. A strong overall result can conceal a weak night shift or a site with poor mobile access.
- Add operational context. Pair communication data with safety reporting frequency, absenteeism, recognition frequency, feedback participation, issue resolution, or turnover indicators. These signals help operations leaders investigate friction without claiming that communication alone caused the result.
Recent frontline guidance recommends segmenting communication results by shift and location and examining delivery, response, absenteeism, recognition, feedback participation, and turnover indicators, as described in Yourco’s frontline engagement analytics guide. The principle is simple: blended averages can hide operational risk.
A mobile-first measurement plan also needs restraint. SMS and push notifications are valuable for time-sensitive updates, but excessive messaging can reduce trust and response quality. Track delivery first, then response latency, link clicks, acknowledgment, and completion. If employees receive a message but can’t complete the action easily from a phone, the channel may be working while the workflow is failing.
The best frontline employee communication KPIs are therefore chosen with operations, not just communications, in mind. Measure whether people can access the information, understand the instruction, and complete the work without unnecessary friction.
The TurnOnWork Outcome-Mapping Matrix
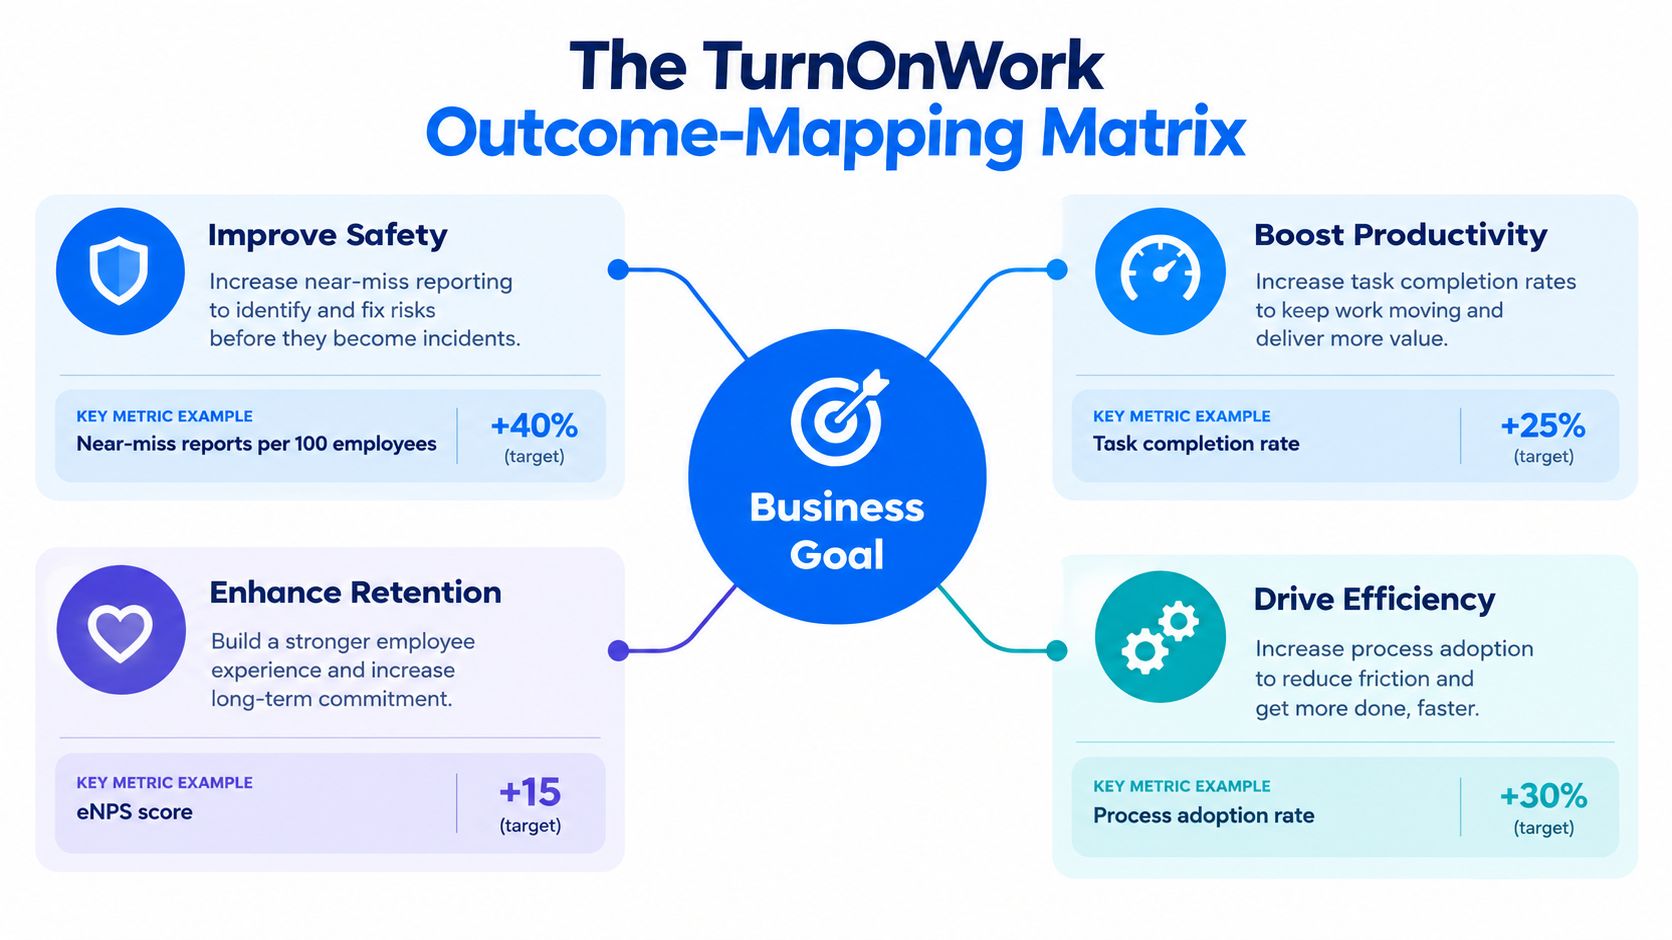
The hard part of internal communications measurement isn’t producing a list of metrics. It’s choosing the measure that fits the business objective. The TurnOnWork Outcome-Mapping Matrix is an editorial model for making that choice before a message is sent.
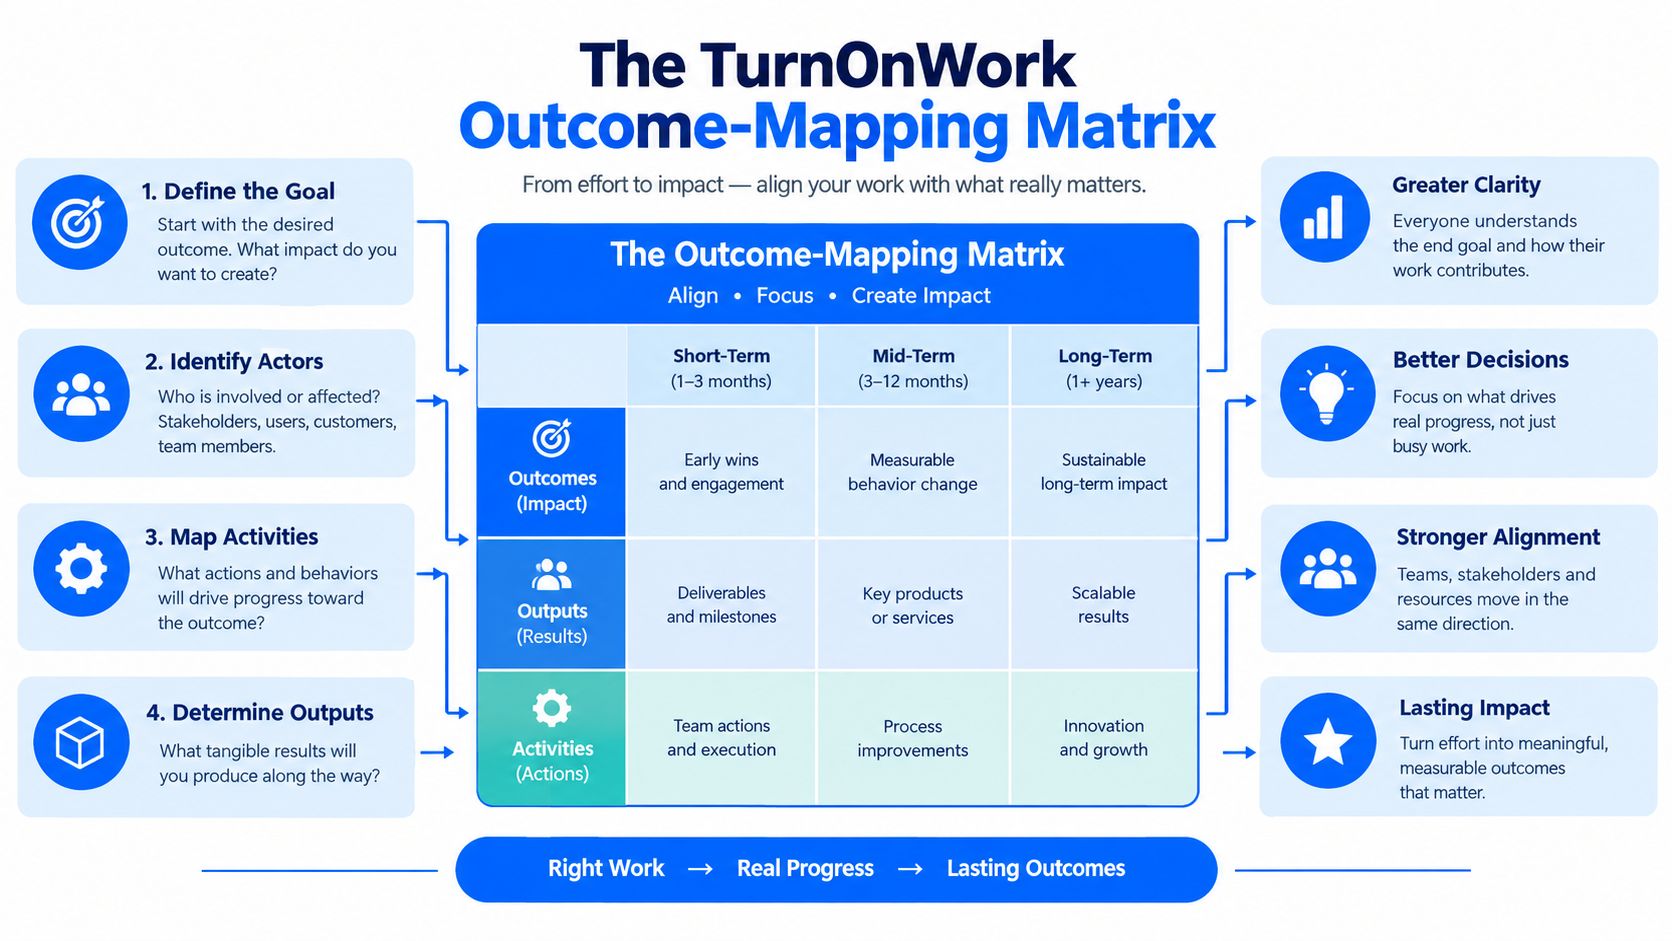
Use the matrix in five moves:
- Name the business goal. Write the operational result in plain language, such as improving safety, increasing tool adoption, reducing avoidable queries, or supporting retention.
- Define the employee behavior. State what employees, managers, or teams must do differently.
- Choose the communication role. Decide whether communication must inform, explain, remind, enable, collect feedback, or coordinate a cascade.
- Select evidence at each level. Choose one reach signal, one comprehension signal, one action measure, and one business-impact measure where data is available.
- Set the review decision. Decide what you’ll change if reach is low, comprehension is weak, action stalls, or the outcome remains unchanged.
Examples of outcome mapping
| Business goal | Communication behavior | Stronger KPI direction |
|---|---|---|
| Improve safety | Employees understand and use the reporting process | Mobile reach, comprehension response, near-miss reporting, issue resolution |
| Boost productivity | Employees complete a task through the intended workflow | App reach, task understanding, completion rate, rework or query trend |
| Enhance retention | Employees receive clear information and can provide feedback | Reach by cohort, sentiment, feedback participation, eNPS or retention indicator |
| Drive efficiency | Employees adopt a new process or tool | Training completion, active use, process completion, support-query trend |
Suppose a company introduces a new frontline scheduling tool. Pageviews and launch-email clicks can show whether employees found the announcement. They can’t prove migration. The stronger chain is mobile delivery, app installation or login, comprehension of the new process, completed schedule actions, and a reduction in avoidable manual follow-up.
For manager cascades, don’t treat a manager’s acknowledgment as proof that a team received the message. Track manager readiness, cascade completion, employee comprehension, question themes, and the downstream action. The work graph perspective is useful here because communication, people, tools, managers, and tasks form a connected operating system rather than separate data silos.
This framework also protects against overclaiming. Communication can contribute to a result while HR policy, manager behavior, system design, staffing, and incentives influence it too. Report the contribution, show the baseline and trend, and name the other factors.
Building an Internal Communications Dashboard for Leadership
A leadership dashboard should expose operational movement, not reward message volume. Keep it to one screen and answer four questions: who was reached, who understood, who acted, and what changed in the workforce or operation. That view is more useful than a long export of email activity, especially in frontline-heavy organizations where mobile access, safety reporting, shift swaps, and task completion matter more than corporate open rates.
A 2026 KPI guide recommends one KPI per family, covering reach by audience, read rate, active user rate, contribution ratio, and one business-impact measure such as eNPS, onboarding completion, or reduced internal email. The approach appears in Jint’s internal communication metrics guide.
The one-screen dashboard structure
- Reach by audience: Report delivery or exposure by location, role, shift, worker type, and device when those differences affect access.
- Read or attention rate: Use open rate, read time, video completion, or repeat access as an attention signal, not as proof of understanding.
- Active user rate: Measure meaningful use of the relevant intranet, app, tool, or workflow. Account creation alone is insufficient.
- Contribution ratio: Track responses, comments, questions, survey participation, safety reports, shift-swap requests, or completed feedback loops.
- Business impact: Choose one outcome tied to the campaign, such as onboarding completion, eNPS, policy adoption, task completion, fewer repeat queries, or increased mobile-app use.
Show the current result beside a baseline or prior period. A single snapshot records activity. A trend helps leadership decide whether communication is supporting sustained adoption or whether the channel, message, or workflow needs adjustment.
Governance determines whether the dashboard is trusted. HRIS data can define the audience, email and intranet analytics can show reach, frontline apps can provide mobile and task signals, survey tools can measure comprehension and sentiment, and workforce systems can add operational context. Protect individual data through aggregate reporting and clear access rules.
A 2025 HR communication metrics guide lists unique intranet logins, video completion, live-poll participation, peer recognition posts, and the share of pulse-survey action items closed within 30 days as useful measures connecting communication with execution, as outlined in Mirro’s HR communication metrics guide.
For teams comparing internal communications measurement tools, assess audience segmentation, channel coverage, trend reporting, campaign comparison, exportability, privacy controls, and integration with HR and operations systems. An employee analytics platform can also bring communication activity, employee feedback, sentiment, and engagement signals into a more usable reporting view. Turn On Work provides editorial guidance on internal communications ROI and measurement metrics, including reach, views, acknowledgment, understanding, completion, time saved, and error or rework volume.
Common Measurement Mistakes and How to Avoid Them
The most damaging measurement mistake is often a reporting habit that nobody challenges. A team sends an all-company email, sees a respectable open rate, and reports success. A frontline location later raises the same questions repeatedly, but the location disappears inside the company average.
The fix is to make segmentation part of the reporting template, not an occasional analysis. Break out location, shift, role, worker type, tenure, and device when those variables affect access or action.
Five traps that weaken internal communications reporting
- Treating opens as comprehension: Add a short pulse question, knowledge check, manager readiness measure, or question-theme review.
- Reporting activity without a decision: Every dashboard measure should support a decision about channel, content, timing, audience, or workflow.
- Blending audiences too early: Review cohorts before calculating a company-wide result. Averages are useful only after gaps are visible.
- Ignoring downstream behavior: Define the completion, adoption, response, or operational measure before launch.
- Collecting data without using it: Assign an owner and a next action for each recurring KPI. Data that never changes a communication or operating decision is expensive decoration.
One 2026 benchmark found that 36% of teams mostly report activity metrics, while 33% don’t consistently use internal communications data. The same benchmark reported employee feedback as the top KPI at 67%, with email open and click rates and employee engagement scores each used by 52%, as summarized in ContactMonkey’s communications measurement research. The gap isn’t a lack of available metrics. It’s the absence of a measurement model that connects them to decisions.
A dashboard should make the next intervention obvious. If nobody can say what they’ll change after reviewing it, the dashboard is a filing cabinet, not a management tool.
Avoid attributing an outcome entirely to communication when managers, HR processes, staffing, technology, and incentives also shaped it. Report what communication contributed, explain the evidence, and identify what remains uncertain.
Internal Communications KPIs and Metrics FAQs
What are internal communications KPIs and metrics?
Internal communications metrics are data points about delivery, attention, feedback, understanding, action, or outcomes. Internal communications KPIs are the selected measures tied to a business or workforce objective, such as policy adoption, tool migration, safety reporting, onboarding completion, or employee sentiment.
How do you measure internal communications effectiveness?
Use the full funnel: measure reach, consumption, comprehension, behavior, and business impact. Open rate and click-through rate establish channel performance, but effectiveness requires evidence that employees understood and completed the intended action.
What are the best internal communications KPIs to track in 2026?
Choose KPIs based on the objective. Useful families include reach by audience, read rate, active user rate, contribution or feedback rate, comprehension, action completion, adoption, sentiment, eNPS, and one operational outcome. Don’t use every measure for every campaign.
How should teams measure communication for frontline and deskless employees?
Start with mobile and operational signals. Track SMS or push delivery, response, app access, device and shift patterns, location, role, and tenure, then connect those results to task completion, safety reporting, issue resolution, attendance, feedback, or other relevant operational measures.
How do you measure internal communications ROI?
Define the business outcome before sending the message, establish a baseline, track the communication contribution, and report the result alongside other influencing factors. ROI measurement can include completed actions, time saved, reduced repeat queries, adoption, error or rework volume, sentiment, or retention indicators when those outcomes are connected to the campaign.
How often should internal communications reporting reach leadership?
Use a layered cadence. Review channel and operational anomalies frequently, examine campaign trends monthly, and present strategic outcomes and resource decisions quarterly. The exact cadence should follow the speed and risk of the business process, not a fixed reporting habit.
Start your next communication campaign with one written business outcome, one defined audience, and one action employees must complete. Then build a simple funnel across reach, comprehension, behavior, and impact, segment it for frontline reality, and review the result with HR and operations. That discipline will replace vanity reporting with evidence leaders can use.