
A contact-center planner can build a schedule that looks correct on paper, then watch service levels fall when call volume shifts, experienced agents are unavailable, or a local event changes demand. Workforce management forecasting begins by estimating future labor demand and required staffing, then matching that demand with available capacity.
Historical data provides the starting material. Some forecasting engines need a complete week without missing time intervals, while advanced models may require at least a year of history, as documented in enterprise workforce management guidance. The result is still an estimate, not a promise.
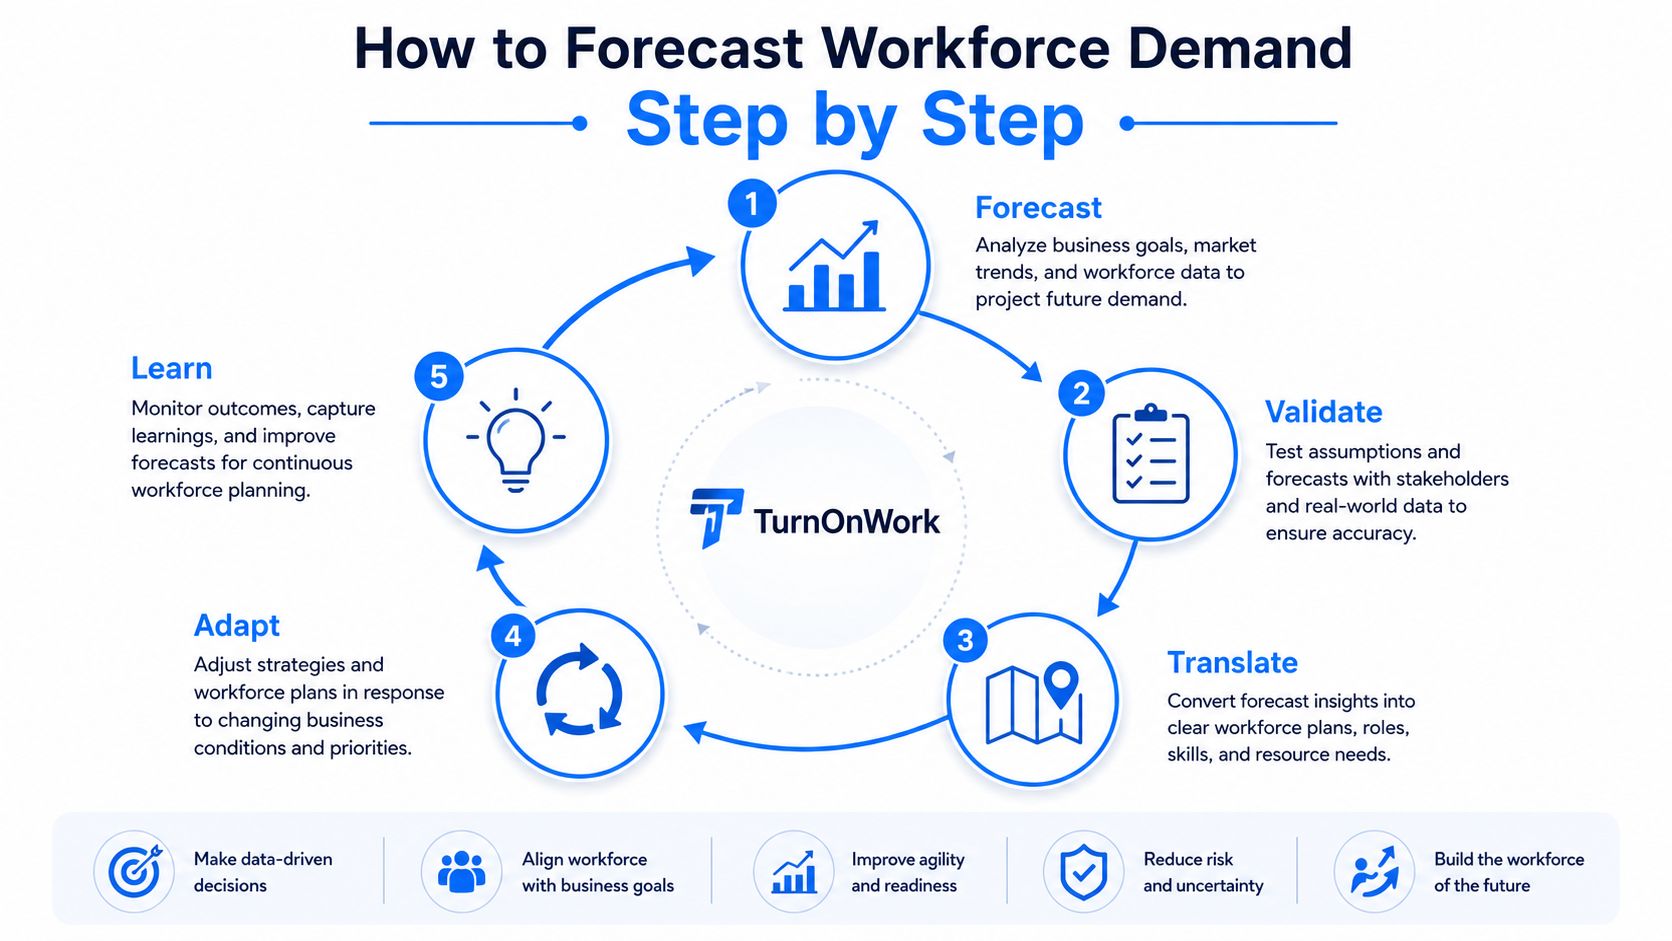
Reliable forecasting follows a cycle: Forecast → Validate → Translate → Adapt → Learn. Validate assumptions against current conditions, translate demand into skills and workable schedules, adapt when reality changes, and learn from the gaps. A hospital roster, retail shift plan, or contact-center schedule can fail even with accurate demand estimates if it ignores preferences, compliance rules, availability, or local context.
What Workforce Management Forecasting Is and Why It Matters
Workforce management forecasting predicts future workload and converts it into the staffing and capacity needed to serve that workload. It helps operations leaders decide how many people they need, when they need them, which skills must be present, and how schedules should change when actual conditions differ from the plan.
Key Takeaways
- Demand comes first: Forecast customer contacts, sales activity, patient demand, deliveries, visits, or tasks before deciding staffing levels.
- Capacity is more than headcount: Availability, skills, productive hours, breaks, training, leave, and compliance rules determine usable capacity.
- Forecasts support decisions: A staffing forecast informs schedules, hiring, cross-training, overtime, and deployment.
- Accuracy needs context: A good average can hide serious interval-level gaps, especially in contact centers and other time-sensitive operations.
- Employee experience is operational: Better communication, usable tools, predictable schedules, and realistic workloads connect forecasting to the broader workforce experience.
A workforce demand forecast estimates the work likely to arrive. A contact center might forecast interactions by channel and interval. A retailer may estimate customer traffic and transactions. A healthcare team could anticipate appointments, admissions, or care tasks. A field-service organization may project jobs by region, skill, and time window.
A capacity forecast estimates the work the current workforce can perform. Ten scheduled employees aren’t equivalent if several lack the required certification, one is assigned to training, and another is unavailable during the peak period. A scheduling forecast goes one step further by showing how that capacity can be arranged into shifts and activities.
The business impact is practical. Understaffing can increase queues, service failures, rushed work, and fatigue. Overstaffing can raise labor cost while leaving employees underutilized. In both cases, poor planning creates communication problems because managers must make last-minute changes and employees receive less predictable schedules.
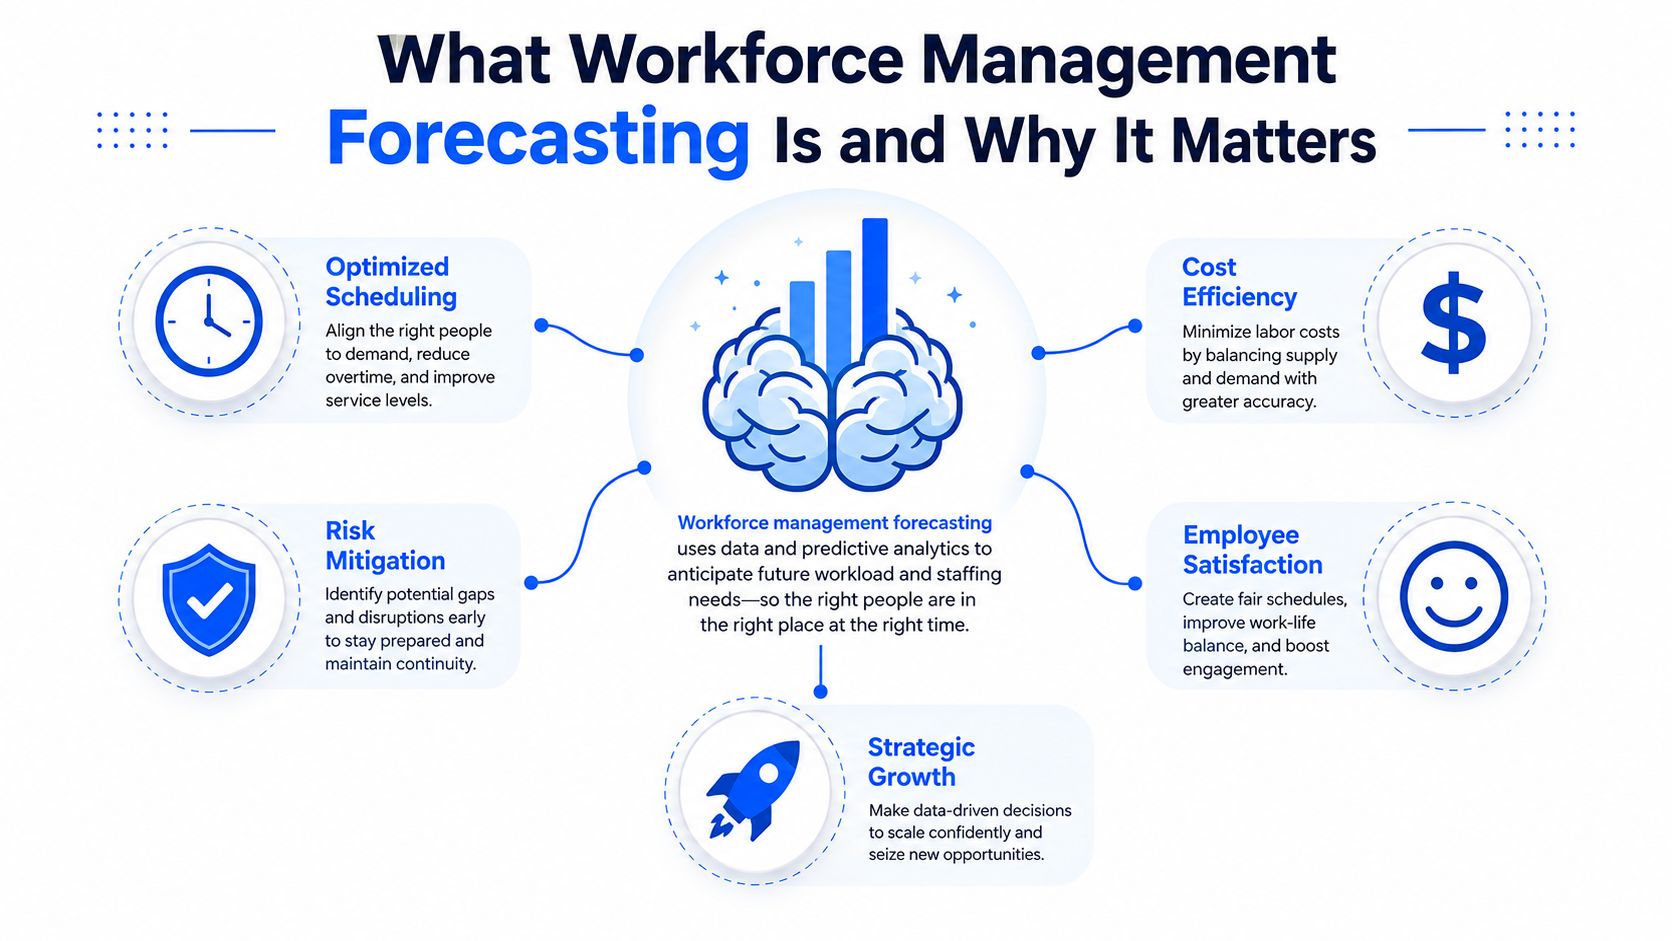
Forecasting supports workforce optimization, but it doesn’t replace judgment. The strongest operation uses forecast outputs to start a conversation about service, cost, employee wellbeing, and operational risk. That makes workforce management forecasting part of workforce operations and employee experience, rather than a narrow scheduling function.
How Workforce Forecasting Differs From Workforce Planning
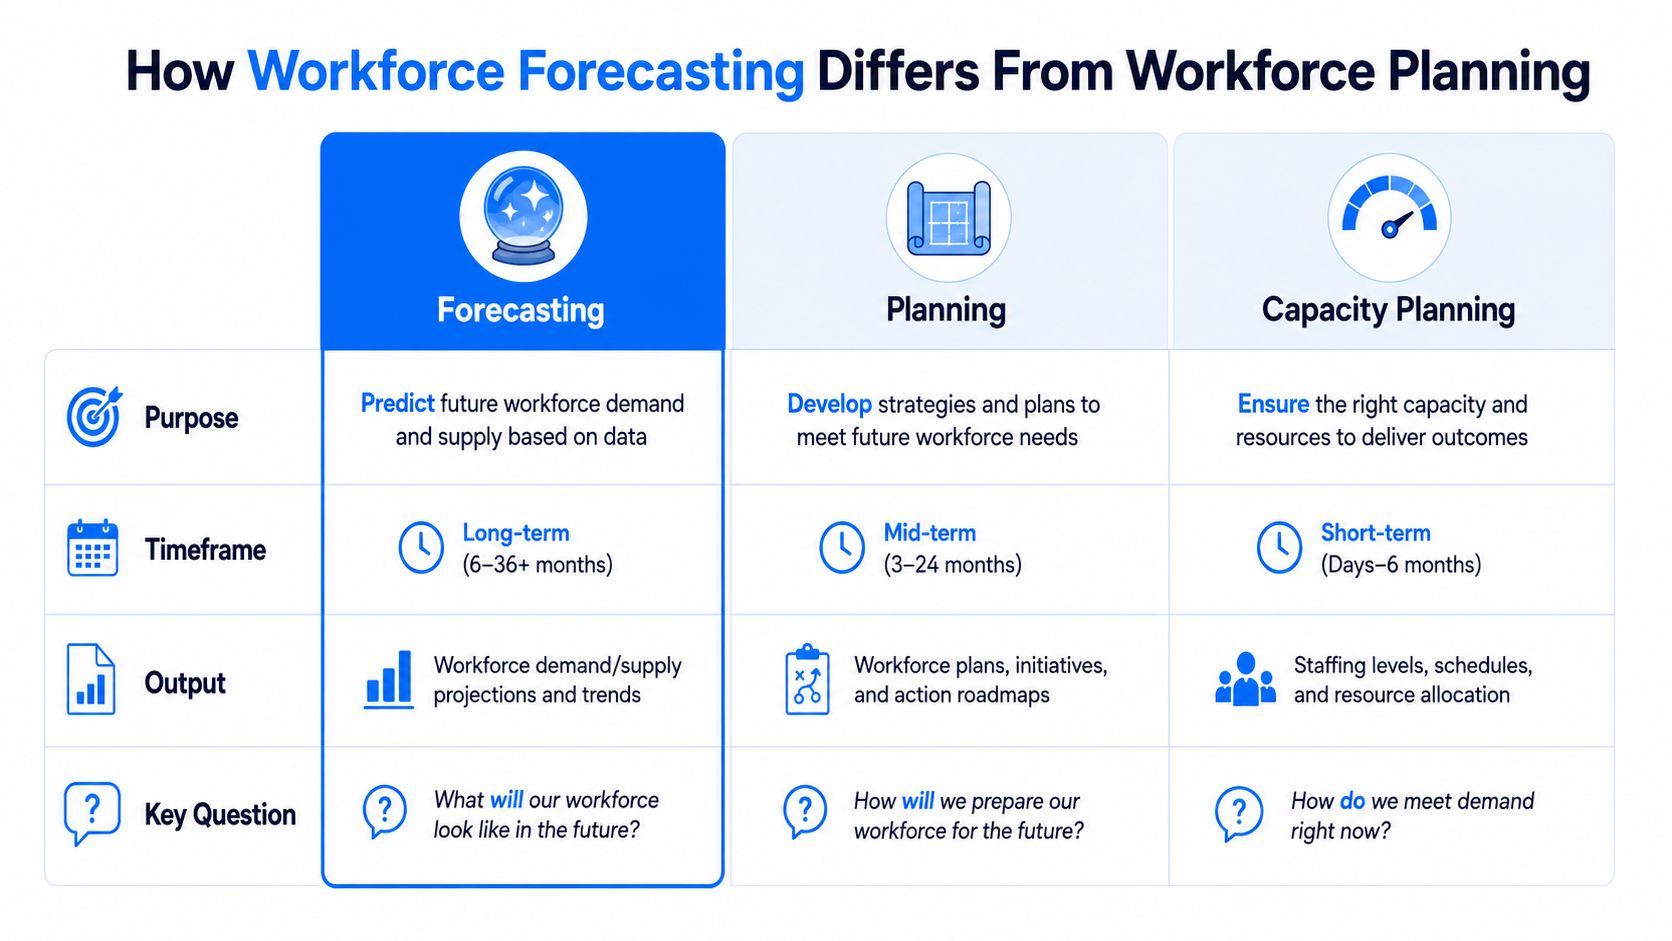
Workforce forecasting predicts future demand and capacity, while workforce planning decides how the organization will build, source, develop, and allocate that capacity. Capacity planning connects the two by testing whether the available workforce can meet expected work under stated constraints.
| Discipline | Primary purpose | Typical horizon | Main output | Key question |
|---|---|---|---|---|
| Workforce forecasting | Estimate future workload and staffing requirements | Short, medium, or long term, depending on the operation | Demand forecast and staffing forecast | What work and coverage should we expect? |
| Workforce planning | Decide how to obtain and develop the required workforce | Longer-term organizational horizon | Hiring, mobility, training, and workforce planning forecast | What workforce should we build? |
| Workforce capacity planning | Compare required work with usable supply | From upcoming schedules to longer-range plans | Capacity gap by time, skill, location, or role | Can available capacity meet demand? |
Forecasting is usually closest to operational data. Planners work with volumes, workload drivers, handling time, attendance, shrinkage, skills, and availability. Workforce planning adds business strategy, organizational design, recruiting, internal mobility, learning, and retention assumptions.
The outputs also differ. A staffing forecast might show that a team needs more coverage during certain periods. A workforce planning forecast may determine whether the organization should hire, train existing employees, change operating hours, or automate part of the work. Capacity planning reveals whether the proposed solution closes the gap.
A simple decision rule helps:
- If the question is “How much work is coming?”, forecasting owns the next step.
- If the question is “Can current people and skills cover it?”, capacity planning owns the analysis.
- If the question is “How will we close the gap?”, workforce planning owns the decision.
This distinction prevents a common failure. Leaders may approve a hiring plan based on total headcount while the operation still lacks coverage at the right location, shift, or skill level. Practical workforce planning guidance and related resources are available in workforce planning coverage, but the operating principle remains simple: forecast the need, test usable capacity, then choose the intervention.
Practical Workforce Forecasting Methods
The right workforce forecasting method depends on data depth, demand stability, business drivers, and the cost of being wrong. A stable operation may need only historical trends. Volatile work, scarce skills, or changing customer behavior calls for drivers, scenarios, or AI support. The method is only the first step. Forecasts must be validated, translated into workable coverage, adapted during execution, and used to improve the next cycle.
Historical and trend forecasting
Historical forecasting projects future demand from earlier patterns. A retail planner can compare similar trading periods. A contact-center planner can review interaction volumes by channel and interval. A field-service team can examine previous job demand by territory.
It is quick to explain and deploy, but its quality depends on the history. Missing intervals, changed activity definitions, unusual events, or inconsistent records can distort the baseline. A clean pattern can still mislead planners when the future includes a new store, changed opening hours, channel migration, labor shortages, policy changes, or a product launch.
Historical data is a starting map, not a promise about the road ahead.
Driver-based forecasting
Driver-based forecasting connects labor demand to the events that create work. Examples include calls offered, average handling time, appointments, transactions, room occupancy, deliveries, production orders, and travel time.
Its main advantage is traceability. A manager can ask why required staffing changed and connect the answer to a business driver. The method depends on reliable driver data and a stable relationship between the driver and labor effort. If task duration changes, work shifts between channels, or a new process adds steps, the model needs review.
For frontline operations, task-level signals can reveal demand that a headcount-only model misses. Teams using task management for frontline teams may have better visibility into recurring work, completion time, location, and operational interruptions.
Scenario forecasting
Scenario forecasting tests several plausible futures instead of presenting one certain answer. A healthcare organization might compare different absence, patient-flow, or skill-availability assumptions. A field-service team might model regional demand, travel constraints, and technician supply.
This method helps when past patterns provide limited guidance and gives decision-makers a clearer view of risk. Its trade-off is assumption quality. A detailed scenario built on weak inputs can create more confidence without creating better decisions. Planners should label the assumptions, identify what would trigger a change, and keep a practical response for each case.
AI and predictive forecasting
AI and predictive forecasting combine automated pattern detection, statistical modeling, machine learning, and scenario analysis. They can identify relationships that manual spreadsheets may miss, support demand prediction, highlight capacity gaps, and suggest schedule options.
AI is not automatically more accurate. Missing data, inconsistent activity codes, biased historical decisions, and poorly defined objectives can pass directly into the output. Planners should check the data used, the assumptions applied, and the reason for each recommendation. Human review also matters when local context changes quickly, such as a transport disruption, a temporary store closure, or a shortage of certified staff.
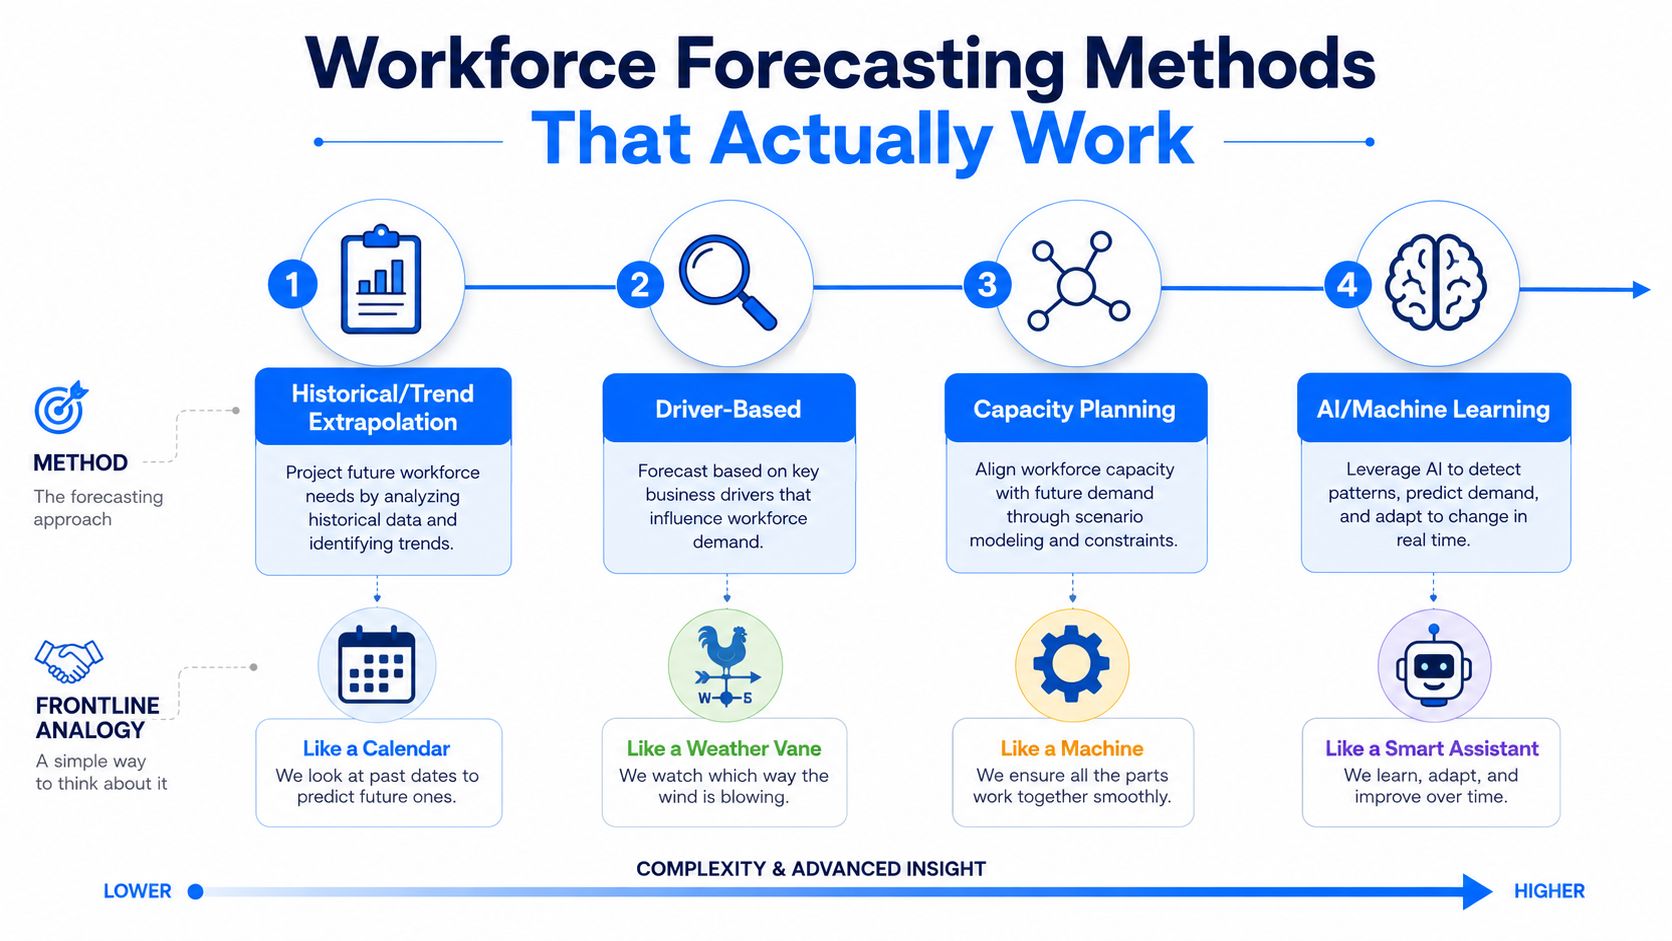
Choose the least complex method that answers the operational question. Reliable history may support trend analysis. A changing operation needs drivers and scenarios. A distributed frontline workforce often needs a hybrid model that combines demand with skills, location, availability, preferences, and manager review. An accurate volume forecast can still produce a poor schedule if the available employees cannot perform the required tasks or work in the required place. Forecast, validate, translate into usable coverage, adapt as conditions change, then learn from the gap between plan and reality.
How to Forecast Workforce Demand Step by Step
Forecast workforce demand by estimating work, checking the evidence, translating workload into usable capacity, adapting during execution, and learning from the difference between forecast and actual results. The following Forecast → Validate → Translate → Adapt → Learn model is a TurnOnWork editorial framework, not an established industry standard.
Forecast
Start with the work, not the headcount. Define the unit of demand, such as contacts, transactions, appointments, jobs, visits, or productive tasks. Select the planning interval that matches how quickly the operation must respond.
Collect the inputs that affect labor demand:
- Historical workload: Volumes, timing, duration, channel, location, role, and skill.
- Business drivers: Promotions, opening hours, campaigns, appointments, service changes, and expected growth.
- Workforce supply: Contracts, availability, skills, certifications, leave, attendance, attrition, and internal movement.
- Productivity constraints: Breaks, training, meetings, travel, equipment, and non-productive activities.
- Operating rules: Compliance requirements, rest rules, local policies, and service commitments.
For long-horizon workforce forecasting, a cohort-based supply model is more useful than a single headcount number. A workforce forecasting framework describes combining deterministic cohort flow for the stable majority with time-series residuals for unexplained variation. It states that the deterministic core can cover 80%+ of the forecast, while residuals capture effects such as labor-market tightness and cultural shifts.
Validate
Check missing intervals, duplicate records, changed definitions, unusual spikes, closures, outages, and one-off events. Ask operational leaders whether an anomaly reflects real demand or a data problem.
Validate assumptions with the people closest to the work. A store manager may know that a local event changed traffic. A nurse manager may know that a service line changed staffing requirements. A field supervisor may know that travel time makes a nominal coverage plan unusable.
Practical rule: Don’t let a model turn an unexplained data error into a published schedule.
Translate
Convert workload into required labor. A basic calculation is:
Required labor hours = forecast workload × expected handling time ÷ productive time per worker
That formula is only a starting point. Translate the result by skill, shift, location, availability, and compliance constraint. A mathematically accurate total can still fail if the right technician is in the wrong region or if a trained employee isn’t available for the required shift.
A forecast becomes a staffing and scheduling forecast. Capacity planning compares required labor with available productive capacity, then identifies hiring, overtime, cross-training, redeployment, or schedule changes.
Adapt
During execution, compare actual demand with the forecast. Managers may need to reallocate people, adjust breaks, move work between channels, call in coverage, or communicate a change to frontline teams. The response should respect employee availability, fatigue, fairness, and local rules.
A workforce execution platform can shorten the distance between detecting a gap and taking action. The operational team still decides whether the recommended action is appropriate.
Learn
At the end of the cycle, compare forecast demand, scheduled capacity, actual work, and outcomes. Record why the forecast missed, whether the error was random or systematic, and which assumptions need revision. Use the results to improve the next cycle, not to punish planners for uncertainty.
The Work Graph perspective is useful here because work, people, skills, tools, and tasks are connected. A learning loop should examine those relationships rather than judge the forecast through a single headcount figure.
Metrics Formulas and How to Measure Forecast Accuracy
Forecast quality needs several measures because accuracy, bias, staffing gaps, service outcomes, and employee impact answer different questions. A forecast can have acceptable average accuracy while repeatedly missing the periods that matter most.
Core formulas and interpretation
Mean Absolute Percentage Error, or MAPE, measures the average absolute difference between forecast and actual demand as a percentage of actual demand. The common relationship is:
Forecast Accuracy = 100% – MAPE
In contact-center-style planning, mature operations commonly use daily accuracy of 90–95% and 30-minute interval accuracy of 80–90% as benchmarks. Interval accuracy below 75% is associated with visible service-level failures, even when scheduling execution is strong, according to forecast accuracy guidance from Decagon.
For example, if actual workload is 1,000 units and the forecast is 950, the variance is negative 50 units. Variance shows the direction and size of the miss, while absolute error removes the direction and shows how far the forecast was from reality.
| Metric | Formula and meaning | When it’s most useful |
|---|---|---|
| Forecast accuracy | 100% minus MAPE. Shows average closeness to actual demand. | Comparing forecast performance across periods, teams, or methods. |
| Variance | Actual demand minus forecast demand. Shows the size and direction of a miss. | Finding periods where demand exceeded or fell below plan. |
| Bias | Average signed error across periods. Shows consistent over- or under-forecasting. | Diagnosing systematic model or planning assumptions. |
| Staffing gap | Required capacity minus available capacity. Shows unmet or excess coverage. | Deciding whether to reallocate, hire, train, or use overtime. |
| Overtime and understaffing | Tracks extra labor and uncovered demand against plan. | Connecting forecast misses to cost, fatigue, and service risk. |
| Schedule adherence | Actual activity compared with scheduled activity. | Separating a forecast problem from an execution problem. |
| Service level | The share of work served within the operational target. | Testing whether coverage translated into customer or patient outcomes. |
| Utilization or occupancy | Productive work relative to available or logged-in time. | Identifying idle capacity, overload, or burnout risk. |
| Time-to-adjust | Time between detecting a deviation and implementing a response. | Assessing operational agility during volatile periods. |
Don’t use one metric as proof of forecasting quality. High accuracy with poor service can indicate a translation or adherence problem. Strong service with excessive overtime can indicate that the team is meeting demand at an unsustainable cost.
The most useful diagnostic separates random error from bias. Random error creates misses in both directions. Bias means the forecast consistently runs high or low, which points to a model, data, or assumption problem. Review metrics by interval, location, skill, channel, and role instead of relying only on an aggregate score.
AI and Automation in Frontline Workforce Forecasting
AI improves workforce forecasting by detecting patterns, modeling scenarios, predicting demand, and recommending schedules, but people must control assumptions, exceptions, fairness, and final decisions. The useful model is human plus AI, not human replaced by AI.
An AI labour planning system can examine relationships across demand, attrition, availability, skills, location, and operating conditions. A workforce planning and automation platform can also compare scenarios, such as a hiring delay, a regional shortage, a change in productivity, or a shift in work mix. AI workforce scheduling then uses those outputs to recommend coverage while considering constraints.
The strongest use cases are specific:
- Pattern detection: Identify recurring demand changes, unusual intervals, or relationships between business drivers and workload.
- Scenario modeling: Compare multiple assumptions instead of relying on one path.
- Demand prediction: Produce forecasts at the level of time, location, channel, skill, or role where the data supports it.
- Schedule recommendations: Match coverage requirements with availability, skills, preferences, and rules.
- Intraday support: Flag emerging gaps and suggest operational responses.
A frequently missed problem is that many models still treat the workforce as static headcount rather than dynamic capacity and skills. Industry analysis from UC Today on the workforce forecasting model highlights lagging indicators, disconnected data, slow planning cycles, and confusion between positions and usable capacity.
That distinction matters most for frontline and deskless teams. A store may have enough employees in total but lack cashiers during a rush. A hospital may have enough staff but not enough people with the required qualification. A field-service company may have technicians available, but not within practical travel distance.
Managers should ask an AI system to explain its inputs, confidence, constraints, and recommended alternatives. Humans remain accountable for fairness, local context, employee communication, exceptions, and the final schedule. For a broader view of AI in workforce management, connect forecasting to task execution, knowledge delivery, and employee feedback rather than treating scheduling as an isolated automation problem.
The market context reinforces this shift. Estimates place the global workforce management market at USD 8.07 billion in 2022 and project USD 19.35 billion by 2030, with an 11.7% CAGR from 2023 to 2030, according to market forecasting data. Other estimates also project double-digit growth, but differing market definitions mean leaders should treat those figures as directional rather than directly comparable.
Workforce Management Forecasting FAQs
How often should workforce forecasts be updated?
Update forecasts according to demand volatility and decision lead time. Stable operations may review on a regular planning cadence, while volatile teams need intraday monitoring and faster reforecasting. Always review forecast versus actual results after meaningful deviations.
What data is needed for workforce forecasting?
You need historical workload, timing, duration, business drivers, workforce availability, skills, leave, shrinkage, productivity constraints, and operating rules. If history is limited, use transparent assumptions and scenario analysis rather than presenting a fragile point estimate as certainty.
What causes workforce forecasts to be inaccurate?
Common causes include missing or inconsistent history, changed work definitions, unusual events, weak business-driver data, outdated attrition assumptions, and failure to account for skills or location. Execution problems, such as poor adherence, can also look like forecast error.
How do forecasts become employee schedules?
Planners translate workload into required productive capacity, separate requirements by skill and location, then assign available employees while respecting availability, preferences, compliance, and shift rules. Managers validate the resulting schedule before publishing it.
What is the difference between workforce forecasting and workforce planning?
Workforce forecasting estimates future demand and required capacity. Workforce planning decides how to build or obtain that capacity through hiring, training, mobility, redesign, or automation. Capacity planning tests whether the proposed workforce can meet the forecast.
How can a frontline organization start with limited data?
Begin with a clearly defined workload unit, reliable manual records, manager knowledge, and a small set of transparent scenarios. Improve data capture gradually, then compare forecast and actual outcomes to identify which signals deserve automation.
Forecasting becomes valuable when it changes decisions, not when it produces a polished number. Start with one operating area, define the demand unit, validate the data with frontline managers, and connect the result to a real scheduling or capacity decision. Then review the outcome with employees and planners, feed the learning back into the model, and expand only when the operating loop is working.
If your organization is struggling with late schedule changes, uneven coverage, or disconnected workforce data, map one upcoming planning cycle using Forecast → Validate → Translate → Adapt → Learn. Document the demand inputs, capacity constraints, employee experience risks, and actual outcomes, then use that evidence to choose the next forecasting method or workforce execution platform.