
The true cost of frontline employee turnover typically ranges from 40% to 200% of the worker’s annual salary, depending on role complexity and skill scarcity. The largest portion often comes from indirect expenses, including lost productivity, vacancy coverage, manager time, and ramp-up delays, rather than recruiting fees alone.
For a frontline team, the practical question is not just how much it costs to hire a replacement. It’s how much operational capacity disappears while the role is vacant, while supervisors cover the gap, and while the new employee learns the work. That broader view turns the cost of employee turnover frontline from an HR metric into a finance and operations measure.
The True Financial Impact of Frontline Churn
At 45% annual turnover, a 10,000-person frontline workforce has 4,500 separations. At $6,500 to $7,000 per replacement, the visible hiring bill equals $29.25 million to $31.5 million, before vacancy coverage and ramp-up losses are added. The frontline turnover cost analysis from Fountain provides context for the replacement-cost range and the operational effects that follow each departure.
Frontline turnover cost is the total financial impact of an employee leaving, from the recruiting invoice through the day the replacement reaches full output. A useful model covers separation administration, recruiting, onboarding, training, vacancy coverage, lost productivity, ramp-up time, and the manager effort required to restore normal operations.
The narrow version of employee turnover cost is visible in a budget. It includes job advertising, screening, background checks, agency staffing, interview time, and onboarding expenses. A commonly cited benchmark places replacement at about 40% of annual salary for a frontline employee. That estimate can help with early planning, but it does not show what an empty role does to schedules, output, service quality, or supervisor capacity.
The indirect cost often drives the larger financial exposure. A vacancy may require overtime or temporary labor, push supervisors onto the floor, slow production, increase service errors, and reduce the time experienced employees have for coaching. After the replacement starts, the organization continues carrying a productivity loss until the new hire reaches acceptable performance.
Practical rule: If the calculator stops when the new hire accepts the offer, it measures part of hiring cost. It does not measure the full operating cost of turnover.
Why scale changes the financial answer
Repeated departures multiply the same spending across recruiting, onboarding, training, coverage, and lost output. The arithmetic also makes the finance case easier to test: 10,000 headcount × 45% turnover = 4,500 separations; 4,500 × $6,500 = $29.25 million in direct replacement cost. Finance teams can then add the local cost of overtime, temporary labor, vacant shifts, and ramp-up time instead of burying those items in general labor variance.
Sector conditions can make the exposure more severe. Quick-service restaurants and retail operations often rely on high-volume hiring, short staffing cycles, and repeated training for similar roles. In those settings, a modest improvement in retention can protect manager hours and operating capacity across many locations, while a vacancy can affect service and output before it appears as a recruiting expense.
Finance leaders should separate turnover rate from turnover cost. The rate shows how often people leave. Cost shows what each departure does to labor spending, service continuity, output, and management capacity. A lower rate can still produce a higher total bill when vacancies are difficult to cover or the role takes longer to reach competency.
Workforce experience belongs in the same calculation. Broken communication, inaccessible knowledge, poor scheduling processes, and constant tool switching create daily friction before resignation. That accumulated friction is workforce experience debt. Retention planning can draw on operational planning principles, including these proven strategies to plan 2025, while adapting them to current workforce conditions.
Building an Accurate Turnover Cost Formula
Frontline turnover cost is driven by more than recruiting invoices. Vacancy coverage, supervisor time, and lost productivity during ramp-up can exceed the visible replacement expenses. A useful finance and operations model starts with the core equation:
Annual turnover cost = frontline headcount × annual turnover rate × replacement cost per departure
The equation becomes useful only when replacement cost reflects the actual role. Calculate it by role family, location, and operating environment rather than applying one blended assumption to warehouse workers, registered nurses, drivers, and store associates.
Follow the calculation in five steps
-
Define the relevant workforce. Count the frontline employees covered by the decision. Separate populations with different vacancy durations, training requirements, pay structures, or service consequences.
-
Calculate annual separations. Multiply headcount by the annual employee turnover rate. A 4,000-person frontline population at 40% annual turnover produces 1,600 separations. A benchmarked example assigns approximately $12,500 per exit, producing about $20 million annually for that workforce. The frontline disengagement cost model from MangoApps illustrates how indirect costs can be missed by simple replacement calculators.
-
Estimate direct cost per departure. Include separation administration, recruiting, hiring, onboarding, training, credentials, uniforms, equipment, agency fees, and assessment costs. Record internal labor by time spent, not only by external invoices.
-
Estimate indirect cost per departure. Add the cost of vacant shifts, overtime, temporary labor, contractors, supervisor and manager time, administration, and lost output. For output-based roles, compare expected productivity with actual productivity throughout the vacancy and ramp-up periods.
-
Multiply and validate. Multiply annual separations by replacement cost per departure. Test the result against payroll, agency, overtime, scheduling, and production records. Each input should have a named owner, a calculation method, and a source that finance can review.
Frontline turnover cost components
| Cost Category | Direct vs Indirect | Calculation Method |
|---|---|---|
| Separation administration | Direct | Value HR and manager time spent on resignation, termination, final payroll, exit processing, and offboarding |
| Recruiting and hiring | Direct | Add advertising, recruiter or agency fees, screening, assessments, interview time, and background checks |
| Onboarding and training | Direct and indirect | Add training materials, credentials, equipment, instructor time, peer time, and supervisor time |
| Vacancy coverage | Indirect | Calculate overtime, temporary labor, contractor, or agency staffing used before the role is filled |
| Lost productivity | Indirect | Estimate the output gap during the vacancy and compare new-hire performance with expected role output |
| Ramp-up cost | Indirect | Value the time required to reach defined productivity or competency standards |
| Operational disruption | Indirect | Estimate service delays, missed work, rework, errors, and manager capacity diverted from normal operations |
Value internal time at the loaded labor cost. If a supervisor interviews candidates, rebuilds schedules, answers repeated questions, and coaches a new starter, those hours belong in the model. The same rule applies to HR administration and peer training.
Keep avoidable turnover cost separate from total turnover cost. Voluntary exits associated with poor communication, weak onboarding, scheduling friction, or limited development may respond to management action. Retirement, seasonal work completion, and some involuntary separations require different assumptions. Treating every departure as equally preventable can inflate the savings case and weaken retention decisions.
The turnover rate and the financial model answer different questions. The rate measures how often employees leave. The cost model measures what each departure does to labor spending, coverage, output, and management capacity. Use this practical guide to the employee turnover rate formula to keep the rate calculation separate from the replacement-cost assumptions built on top of it.
Benchmarking Costs Across Frontline Sectors
Frontline replacement cost depends on role complexity, labor scarcity, vacancy duration, and the operational consequences of an unfilled position. Applying one percentage to every hourly or deskless role produces a tidy estimate, but it can send retention funding toward the wrong jobs.
For planning, frontline replacement cost is often estimated at 30% to 50% of annual wage, while broader expert ranges reach 50% to 200% of annual salary when specialized skills and lost capacity are included. Routine positions such as warehouse pickers or line cooks have been estimated at roughly 40% of annual pay, compared with about 80% of annual pay for mid-skill technical roles such as forklift operators or CDL drivers. Fountain’s frontline replacement-cost guide supports segmenting assumptions by role rather than applying one company-wide rate.
Compare risk by role family
Healthcare shows why finance teams need to model operating effects alongside recruiting expense. One estimate places registered nurse replacement at about $60,090, while another puts typical hospital nurse replacement at about $56,300. The same healthcare benchmarks report hospital RN turnover of 18.4% and estimate that each one percentage-point change in RN turnover costs a typical hospital about $262,500 per year, according to healthcare and frontline turnover benchmarks compiled by WorkTime. These figures show how a seemingly modest rate change can affect annual operating results.
Retail and other high-volume sectors produce a different cost pattern. Replacement cost per employee may be lower than in specialized healthcare, yet repeated departures generate recurring recruiting, onboarding, training, scheduling, and coverage work. In these environments, vacancy coverage and ramp-up productivity loss can outweigh the nominal hiring expense because the events occur across a much larger employee population.
A practical benchmarking matrix should answer four questions:
- How scarce is the skill? Credentials, technical judgment, and a commercial license generally raise replacement cost.
- How long is the vacancy? A quick backfill limits coverage exposure, while a prolonged search can increase overtime and agency staffing.
- How quickly does the new hire become productive? A longer ramp-up extends the period of reduced output and supervisor support.
- What happens when the role is uncovered? A missed shift, delayed delivery, patient-care disruption, or production interruption may create costs beyond wages.
Healthcare leaders can apply the same role-based approach with employee retention in healthcare guidance. The financial priority is to target roles where lost productivity, coverage pressure, and service continuity create the greatest exposure, rather than pursuing an identical turnover reduction across every department.
Connecting Workforce Experience to Operational Savings
Retention spending earns its place in the budget when it removes a measurable operating cost. A broad engagement campaign may improve sentiment without reducing vacancy coverage, manager workload, or time to competency. Finance and HR should connect each experience problem to the expense it creates, then fund interventions that address the largest exposure.
A missed update in email can lead to a failed task or repeated customer question. Training that is difficult to find on a mobile device can extend a new hire’s ramp-up period. Disconnected scheduling tools can leave supervisors correcting shifts by hand. These are workforce experience issues, yet their financial effects appear in administrative hours, service errors, overtime, coverage arrangements, and lost output.
The largest savings often come from indirect costs. Hiring fees are visible and easy to assign to a requisition. Vacancy coverage and reduced productivity continue through the gap between an employee’s departure and a replacement’s full contribution. A finance model should therefore track the operating consequence of turnover, not only the transaction that fills the role.
Use a connected operating model
Start with communication at the point of work. Segment messages by role, site, shift, language, and urgency. A frontline employee communication platform can help organizations deliver relevant updates across mobile and other employee-facing channels. Then check whether the information changed behavior. Clear communication supports scheduling, staffing, and management processes, although it cannot correct inadequate staffing or unfair schedules.
Frontline enablement should reduce the time employees spend searching for answers. Mobile-first procedures, searchable knowledge, short learning modules, and clear task ownership can shorten training effort and help new hires reach the required standard sooner. AI can classify questions, surface relevant procedures, and reveal recurring friction. Supervisors still need to confirm that suggested answers match actual working conditions.
Scheduling requires the same financial discipline. Track unfilled work, shift swaps, exceptions, manual corrections, overtime, and agency usage. Repeated coverage purchases for predictable gaps indicate a process or staffing problem that deserves investigation. Treating those costs as unavoidable hides the operational return available from improving the schedule.
Operational test: Every retention intervention should map to a measurable cost driver, such as vacancy days, overtime hours, training effort, manager time, early attrition, or time to competency.
Build the TurnOnWork decision loop
The following is a TurnOnWork editorial model, not an established industry standard:
- Listen at the point of work. Combine focused feedback from frontline and deskless employees with signals such as missed tasks, schedule exceptions, and repeated tool switching.
- Diagnose the friction. Distinguish communication issues from workload, manager behavior, scheduling, pay, training, and equipment problems.
- Assign ownership. HR may own policy, internal communications may own message design, and operations may own staffing or workflow changes. Give one named owner responsibility for coordinating the response.
- Act with human judgment. Use AI to organize signals and suggest patterns. Supervisors and operational leaders should validate the cause before a process changes.
- Measure the financial connection. Compare turnover, absenteeism, overtime, vacancy coverage, and time to productivity by location or role family.
Turn On Work is one option for connecting workforce experience content with frontline operations, internal communication, engagement, and employee-facing technology. Its digital employee experience guidance for frontline teams applies when leaders assess mobile access, knowledge delivery, and tool friction.
A retention program should identify where experience failures create avoidable operating costs, then test whether a targeted change improves employee experience and financial performance together.
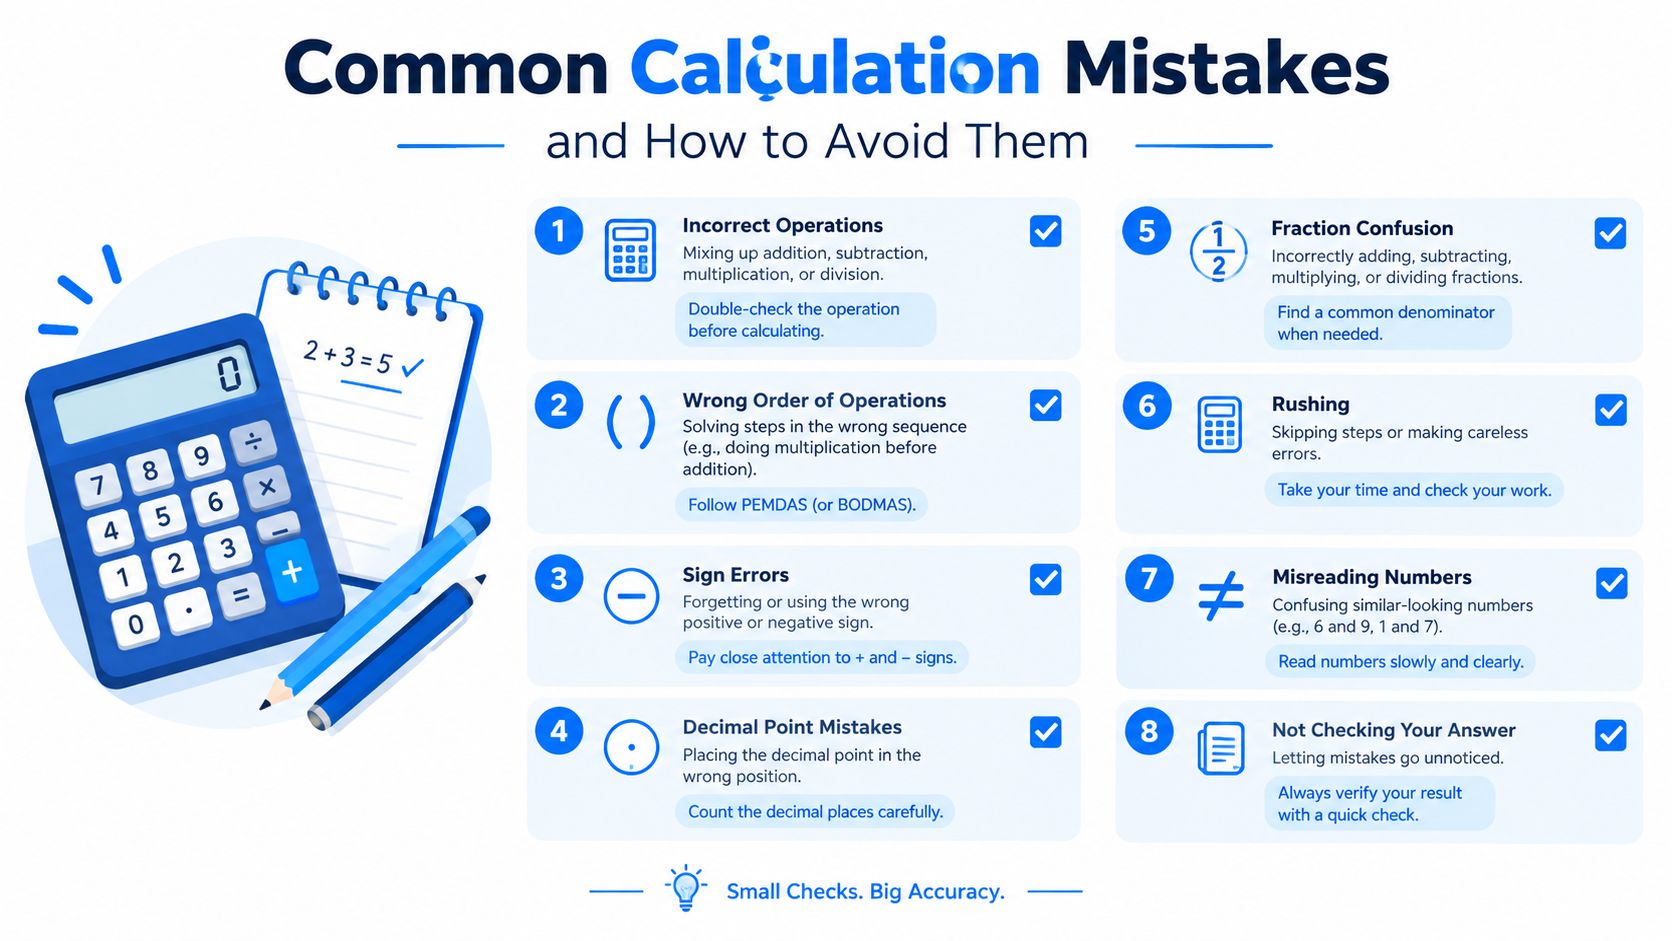
Common Calculation Mistakes and How to Avoid Them
Recruiting spend is only one line in a frontline turnover calculation. A model that stops at advertising, interviews, and hiring fees misses vacancy coverage, lost productivity during ramp-up, manager time, and the operating disruption created by an open role. Those indirect costs can outweigh the recruiting invoice.
Applying one flat percentage to every frontline position creates a second error. A warehouse picker, CDL driver, registered nurse, and store associate may all be hourly or deskless employees, yet their hiring difficulty, training requirements, vacancy effects, and time to competency can differ substantially. Use role-level assumptions instead of presenting a single replacement figure as a finance-ready answer.
Audit the model before presenting it to finance
- Check the denominator. Match the headcount and turnover rate to the same employee population and time period.
- Separate exits from vacancies. The departure date does not mark the replacement start. Measure the gap between those events.
- Include ramp-up. Define the role’s productivity standard and estimate how quickly the new hire approaches it.
- Value manager time. Count interviews, schedule changes, coaching, training, and follow-up work.
- Count coverage. Add overtime, temporary labor, contractors, and agency staffing used while the position is open.
- Segment roles. Set different assumptions for routine, technical, credentialed, and high-impact positions.
- Distinguish causes. Separate voluntary, involuntary, seasonal, retirement, and restructuring-related turnover.
- Reconcile with operations. Compare the estimate with payroll, overtime, agency invoices, training records, and production or service data.
Prevent double-counting. If overtime already includes supervisor coverage, do not add those same hours as a separate vacancy-cost line. Label every input as an invoice, allocation, estimate, or measured operational loss so finance can test the assumptions.
Communication belongs in the calculation when unclear messages increase training effort, adoption delays, or operating errors. Teams can use this internal communications ROI framework to connect communication activity with business outcomes without treating message volume as proof of retention impact.
Cost of Employee Turnover Frontline FAQs
What is the cost of employee turnover?
Employee turnover cost is the financial and operational burden of restoring a role after someone leaves. It includes separation administration, recruiting, hiring, onboarding, training, vacancy coverage, manager time, lost output, and the new employee’s ramp-up period.
For frontline work, role-specific assumptions are more useful than one company-wide percentage. Routine positions may be relatively quick to refill, while credentialed or scarce roles can create longer vacancies, heavier coverage requirements, and greater productivity loss. Fountain’s replacement-cost guidance also supports tailoring replacement estimates to the role rather than applying one broad multiplier. For role-specific replacement ranges, see the benchmarking section above.
The largest financial difference often comes from what happens after the departure. A position filled quickly may require limited coverage, while a prolonged vacancy can generate overtime, agency expense, schedule disruption, and missed output before the replacement reaches standard productivity.
How do you calculate the cost of employee turnover?
Start with:
Annual turnover cost = headcount × turnover rate × replacement cost per departure
Build the replacement cost from direct expenses and operating losses, then calculate separately by role, location, or business unit where vacancy duration, coverage needs, or ramp-up patterns differ. Finance should be able to see which inputs are invoiced, allocated, estimated, or measured through operational data.
What is the difference between turnover rate and turnover cost?
The employee turnover rate shows the share of the workforce that leaves during a defined period. Turnover cost shows the financial effect of those departures. A role with fewer exits can still create greater risk if each vacancy requires expensive coverage or a long training period.
Should overtime and agency staffing be included?
Yes, when those costs cover a vacancy created by turnover. Include overtime, temporary labor, contractor expense, and agency staffing, and label each as vacancy coverage. Exclude normal staffing expense. If overtime already contains supervisor coverage, do not count the same hours again under manager time.
How should manager and HR time be valued?
Multiply time spent on termination, recruiting, interviews, scheduling, onboarding, training, and follow-up by the relevant loaded labor cost. Where exact tracking is unavailable, document an estimate and refine it as managers record work linked to open positions.
Are separation costs different for voluntary and involuntary turnover?
They can be. Offboarding, payroll, benefits, severance, investigation, and equipment recovery may differ by departure type. Calculate these costs separately, then distinguish avoidable turnover cost from restructuring, seasonal completion, retirement, or other exits outside a retention program’s control.
What should an employee turnover calculator include?
Include headcount, turnover rate, separations, wage or salary, recruiting, onboarding, training, vacancy days, coverage labor, manager time, administration, and ramp-up productivity loss. Let users set assumptions by role family instead of forcing one replacement percentage across the frontline workforce.
Calculate by role family this month. Compare the result with overtime, agency invoices, vacancy days, training effort, and productivity records. Use the gaps to select one retention action, such as clearer shift communication, mobile-first onboarding, manager check-ins, or simpler task tools. Assign an owner to measure whether it reduces workforce friction and avoidable operating cost.